Study note: Community detection or Principal Component Analysis - Different apporaches to analyze big datasets
Introduction
This tutorial picks up where the Fslab advanced tutorials Correlation network ended. The goal of this blogpost is to showcase different methods to analyze big datasets: The graph-Analysis apporach featuring community detection and ontology enrichment vs the principal component analysis approach that reduces the dimensions of complex datasets.
We are using the following libraries:
Loading the previous graph
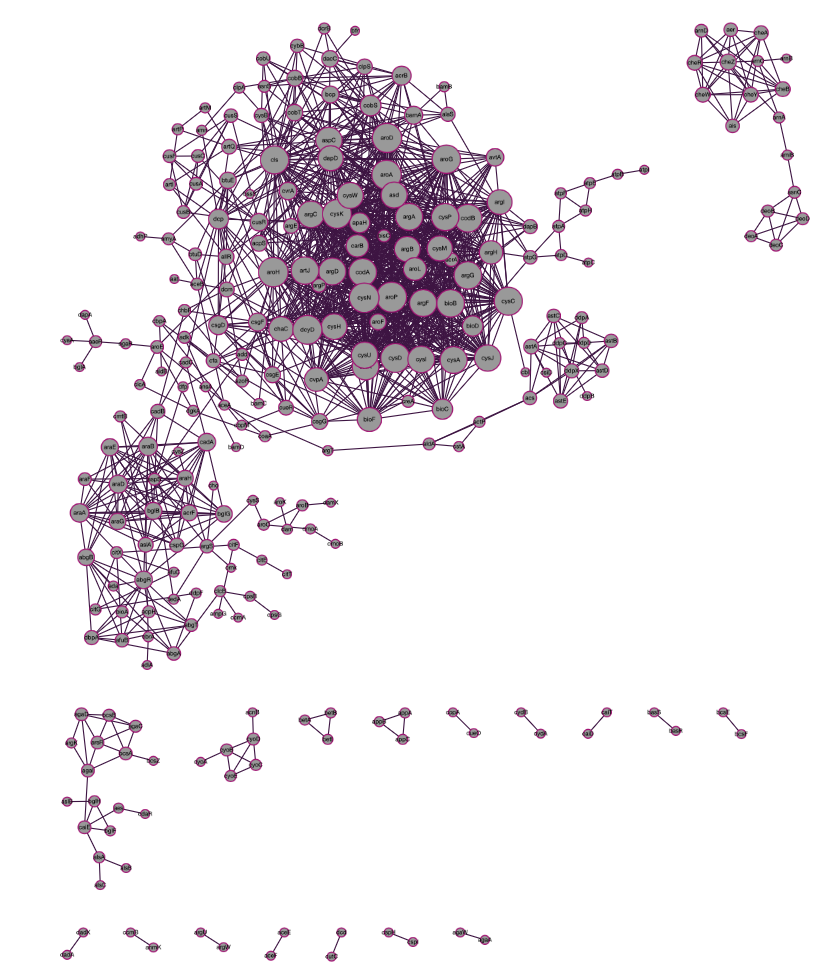
We start by recreating the graph depicted in Correlation network .
#r "nuget: FSharp.Data, 4.2.7"
#r "nuget: Deedle, 2.5.0"
#r "nuget: FSharp.Stats, 0.4.3"
#r "nuget: Cyjs.NET, 0.0.4"
#r "nuget: Plotly.NET, 4.0.0"
#r "nuget: Plotly.NET.Interactive, 4.0.0"

open Deedle
open FSharp.Data
open FSharp.Stats
open FSharp.Stats.Testing
open Cyjs.NET
open Plotly.NET
open Plotly.NET.StyleParam
open Plotly.NET.Interactive

// Load the data
let rawData = Http.RequestString @"https://raw.githubusercontent.com/HLWeil/datasets/main/data/ecoliGeneExpression.tsv"

// Create a deedle frame and index the rows with the values of the "Key" column.
let rawFrame : Frame<string,string> =
    Frame.ReadCsvString(rawData, separators = "\t")
    |> Frame.take 500
    |> Frame.indexRows "Key"

// Get the rows as a matrix
let rows =
    rawFrame
    |> Frame.toJaggedArray
    |> Matrix.ofJaggedArray

// Create a correlation network by computing the pearson correlation between every two rows
let correlationNetwork =
    Correlation.Matrix.rowWisePearson rows

let thr = 0.8203125

// Set all correlations less strong than the critical threshold to 0
let filteredNetwork =
    correlationNetwork
    |> Matrix.map (fun v -> if (abs v) > thr then v else 0.)

// The styled vertices. The size is based on the degree of this vertex, so that more heavily connected nodes are emphasized
let cytoVertices =
    rawFrame.RowKeys
    |> Seq.toList
    |> List.indexed
    |> List.choose (fun (i,v) ->
        let degree =
            Matrix.getRow filteredNetwork i
            |> Seq.filter ((<>) 0.)
            |> Seq.length
        let styling = [CyParam.label v; CyParam.weight (sqrt (float degree) + 1. |> (*) 10.)]

        if degree > 1 then
            Some (Elements.node (string i) styling)
        else
            None
    )

// Styled edges
let cytoEdgesOG =
    let len = filteredNetwork.Dimensions |> fst
    [
        for i = 0 to len - 1 do
            for j = i + 1 to len - 1 do
                let v = filteredNetwork.[i,j]
                if v <> 0. then yield i,j,v
    ]
    |> List.mapi (fun i (v1,v2,weight) ->
        let styling = [CyParam.weight (0.2 * weight)]
        Elements.edge ("e" + string i) (string v1) (string v2) styling
    )

// Resulting cytograph
let cytoGraph =

    CyGraph.initEmpty ()
    |> CyGraph.withElements cytoVertices
    |> CyGraph.withElements cytoEdgesOG
    |> CyGraph.withStyle "node"
        [
            CyParam.shape "circle"
            CyParam.content =. CyParam.label
            CyParam.width =. CyParam.weight
            CyParam.height =. CyParam.weight
            CyParam.Text.Align.center
            CyParam.Border.color "#A00975"
            CyParam.Border.width 3
        ]
    |> CyGraph.withStyle "edge"
        [
            CyParam.Line.color "#3D1244"
        ]
    |> CyGraph.withLayout (Layout.initCose (Layout.LayoutOptions.Cose(NodeOverlap = 400,ComponentSpacing = 100)))
- Cyjs.NET, 0.0.4
- Deedle, 2.5.0
- FSharp.Data, 4.2.7
- FSharp.Stats, 0.4.3
- Plotly.NET, 4.0.0
- Plotly.NET.Interactive, 4.0.0

Now to recreate this graph in FSharp.FGl.ArrayAdjacencyGraph we simply have to create a vertex list and an edge list: Once again we are using the data from Correlation network .
#r "nuget: FSharp.FGL, 0.0.2"
#r "nuget: FSharp.FGL.ArrayAdjacencyGraph, 0.0.2"

open FSharp.FGL.ArrayAdjacencyGraph

// Creates a vertex list based on the cytoVertices
let vertexList =
    rawFrame.RowKeys
    |> Seq.toList
    |> List.indexed
    |> List.choose (fun (i,v) ->
        let degree =
            Matrix.getRow filteredNetwork i
            |> Seq.filter ((<>) 0.)
            |> Seq.length

        if degree > 1 then
            Some (i,v)
        else
            None
    )

// Creates an edge list based on the cytoEdges
let edgeList =
    let len = filteredNetwork.Dimensions |> fst
    [
        for i = 0 to len - 1 do
            for j = i + 1 to len - 1 do
                let v = filteredNetwork.[i,j]
                if v <> 0. then yield i,j,v
    ]

// Creates an ArrayAdjacencyGraph based on vertexList and edgeList
let startingGraph =
    Graph.createOfEdgelist vertexList edgeList
- FSharp.FGL, 0.0.2
- FSharp.FGL.ArrayAdjacencyGraph, 0.0.2
Modularity
One crucial factor in network science is the ability to represent large datasets in comprehensible graphs. But when these graphs get to large, it is often very difficult to retrieve useful data from them without using some form of simplification. One such method is the decomposition of networks into communities, sets of highly interconnected vertices. By reducing the information of each of the vertices into these communities the size of the network can be reduced quite effectively. The interdependence of the community-building vertices is often based on a functional module that the vertices belong to. As such, the detection of communities is a really interesting factor in network science. The Louvain-algorithm, published in Blondel, Vincent D; Guillaume, Jean-Loup; Lambiotte, Renaud; Lefebvre, Etienne (9 October 2008). "Fast unfolding of communities in large networks". Journal of Statistical Mechanics: Theory and Experiment. 2008 (10): P10008. arXiv:0803.0476. Bibcode:2008JSMTE..10..008B. doi:10.1088/1742-5468/2008/10/P10008. S2CID 334423 , is one of the possible algorithms for community detection and has been integrated into FSharp.FGL.
Here we apply this algorithm on our existing graph:
open ArrayAdjacencyGraph.Algorithms.Louvain.Louvain

// The graph after being grouped into communities
let louvainGraph =
    louvain startingGraph 0.1
new modularity= 0.4884290168
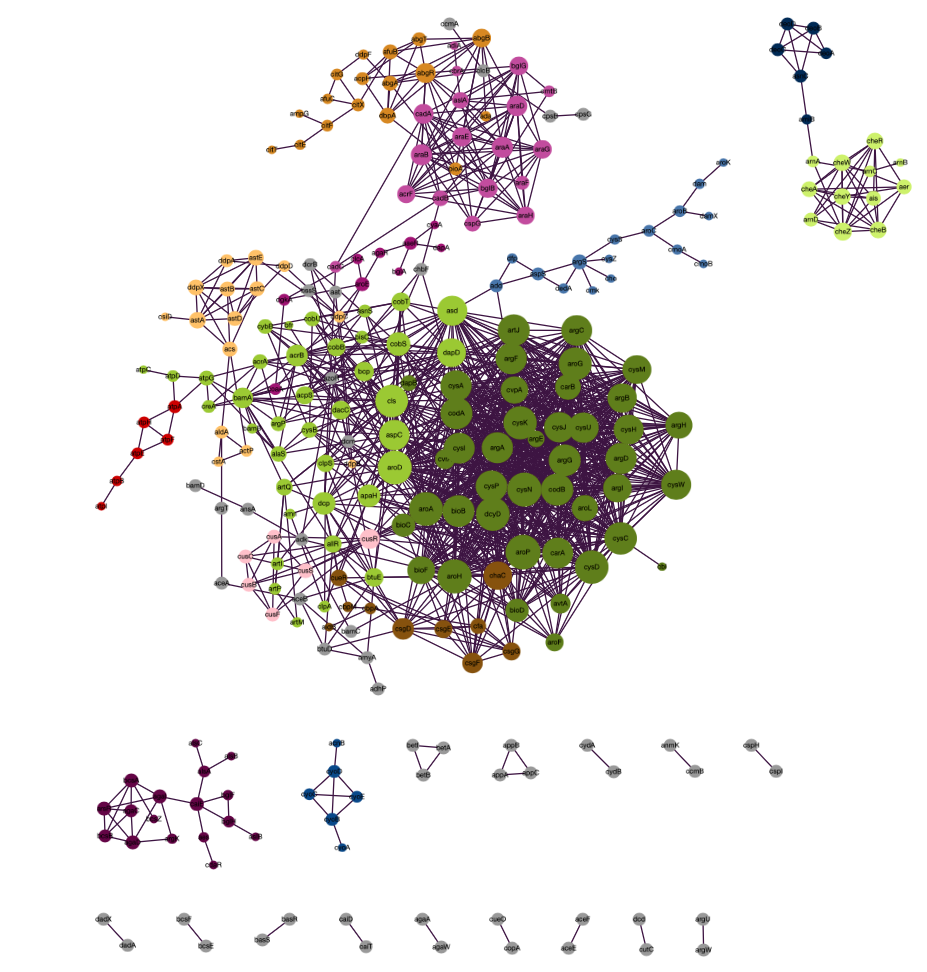
The Louvain algorithm reveals that the graph can be rationed into 34 communities. In the following steps, we color the communities that feature more than 5 members using Cyjs.Net.
// Map that connected the community identifier with a color codex
let colorMap =

    // List of all communities that have more than 5 members
    let communitiesToColorList =
        Vertices.getLabelList louvainGraph
        |> Array.map (snd)
        |> Array.countBy (fun x -> x)
        |> Array.choose(fun (m,count) ->
            if count > 5 then
                Some m
            else
                None
            )
        |> List.ofArray

    // List of hexadecimal colors.
    [
        "#A00976";
        "#D68A0C";
        "#13478D";
        "#9ACB0B";
        "#C249A1";
        "#FFC360";
        "#4B74AD";
        "#CCF35C";
        "#640048";
        "#855300";
        "#052858";
        "#5E7F00";
        "#CC0000";
        "#FFC0CB"

    ]
    |> List.map2(fun community color -> (community,color)) communitiesToColorList
    |> Map.ofList

// Map that maps the gene name to the color it is associated with because of its community
let geneNameToColor =

    let louvainLabelToColor=
        Vertices.getLabelList louvainGraph
        |> Array.countBy (fun (gene,x) -> x)
        |> Array.choose(fun (m,count) ->
            if count > 5 then
                Some m
            else
                None
            )
        |> Array.map(fun x -> (x,colorMap.Item (x)))
        |> Map.ofArray

    Vertices.getLabelList louvainGraph
    |> Array.map(fun (gene,label) ->
        (gene,
            (if (Map.containsKey label louvainLabelToColor) then Map.find label louvainLabelToColor
            else "#808080"))
    )
    |> Map.ofArray

// Table that showcases all communities, their member count and their connected color
let colorTable =
    let header = ["<b>Community</b>";"Number of members";"Color"]
    let rows =
        Vertices.getLabelList louvainGraph
        |> Array.map (snd)
        |> Array.countBy (fun x -> x)
        |> Array.sortByDescending (fun (community,count) -> count)
        |> Array.map(fun (community,count) -> [(sprintf "%i" community);(sprintf "%i" count);(if (Map.containsKey community colorMap) then (colorMap.Item community) else "#808080")])
    let cellColor =
        Array.map(fun l ->
            let color = Color.fromString (List.last l)
            [Color.fromString "transparent";Color.fromString "transparent";color]) rows
        |> Seq.transpose
        |> Seq.map Color.fromColors
        |> Color.fromColors
    Chart.Table(
        header,
        rows,
        HeaderOutlineColor = Color.fromString "black",
        CellsOutlineColor = Color.fromString "black",
        CellsOutlineWidth = 0.1,
        CellsFillColor = cellColor
    )

colorTable
// The styled vertices. The color of the vertices is based on their community. The size is based on the degree of this vertex, so that more heavily connected nodes are emphasized.
let cytoVertices2 =
    Array.map2 (fun v l -> (v,l)) (louvainGraph.GetVertices()) (Vertices.getLabelList louvainGraph)
    |> List.ofArray
    |> List.map(fun (v,(l,c)) ->
        let styling = [CyParam.label l;if (Map.containsKey c colorMap) then CyParam.color (colorMap.Item (c));CyParam.weight (sqrt (float (Vertices.degree v louvainGraph)) + 1. |> (*) 10.)]
        (Elements.node (string v) styling)

    )

// Creates an edge list based on the cytoEdges
let cytoEdges =
    edgeList
    |> List.mapi (fun i (v1,v2,weight) ->
        let styling = [CyParam.weight (0.2 * weight)]
        Elements.edge ("e" + string i) (string v1) (string v2) styling
    )

// Resulting cytograph
let cytoGraph2 =

    CyGraph.initEmpty ()
    |> CyGraph.withElements cytoVertices2
    |> CyGraph.withElements cytoEdges
    |> CyGraph.withStyle "node"
        [
            CyParam.shape "circle"
            CyParam.content =. CyParam.label
            CyParam.width =. CyParam.weight
            CyParam.height =. CyParam.weight
            CyParam.Text.Align.center
            CyParam.Border.color =. CyParam.color
            CyParam.Background.color =. CyParam.color
        ]
    |> CyGraph.withStyle "edge"
        [
            CyParam.Line.color "#3D1244"
        ]
    |> CyGraph.withLayout (Layout.initCose (Layout.LayoutOptions.Cose(NodeOverlap = 400,ComponentSpacing = 100)))

PCA - Principal component analysis
An entirely different approach to the graph analysis is given by the principal component analysis (PCA) . It is most commonly used for dimensional reduction and to build predictive models. In our case we reduce the dimensions of experiments from the data we used to create the first graph. More accurately, the PCA reduces the dataset by highlighting its biggest variances. The PCA algorithm can be found in FSharp.Stats.
let pcaData =
    rows
    |> Matrix.transpose
    |> fun x ->
        let pcaComponents = ML.Unsupervised.PCA.compute (ML.Unsupervised.PCA.toAdjustCenter x) x

        let pComponent1 = pcaComponents.[0]
        let pComponent2 = pcaComponents.[1]
        let x = pComponent1.EigenVector
        let y = pComponent2.EigenVector

        let pcaCoordinates = Array.map2 (fun c1 c2 -> (c1,c2)) x y

        pcaCoordinates
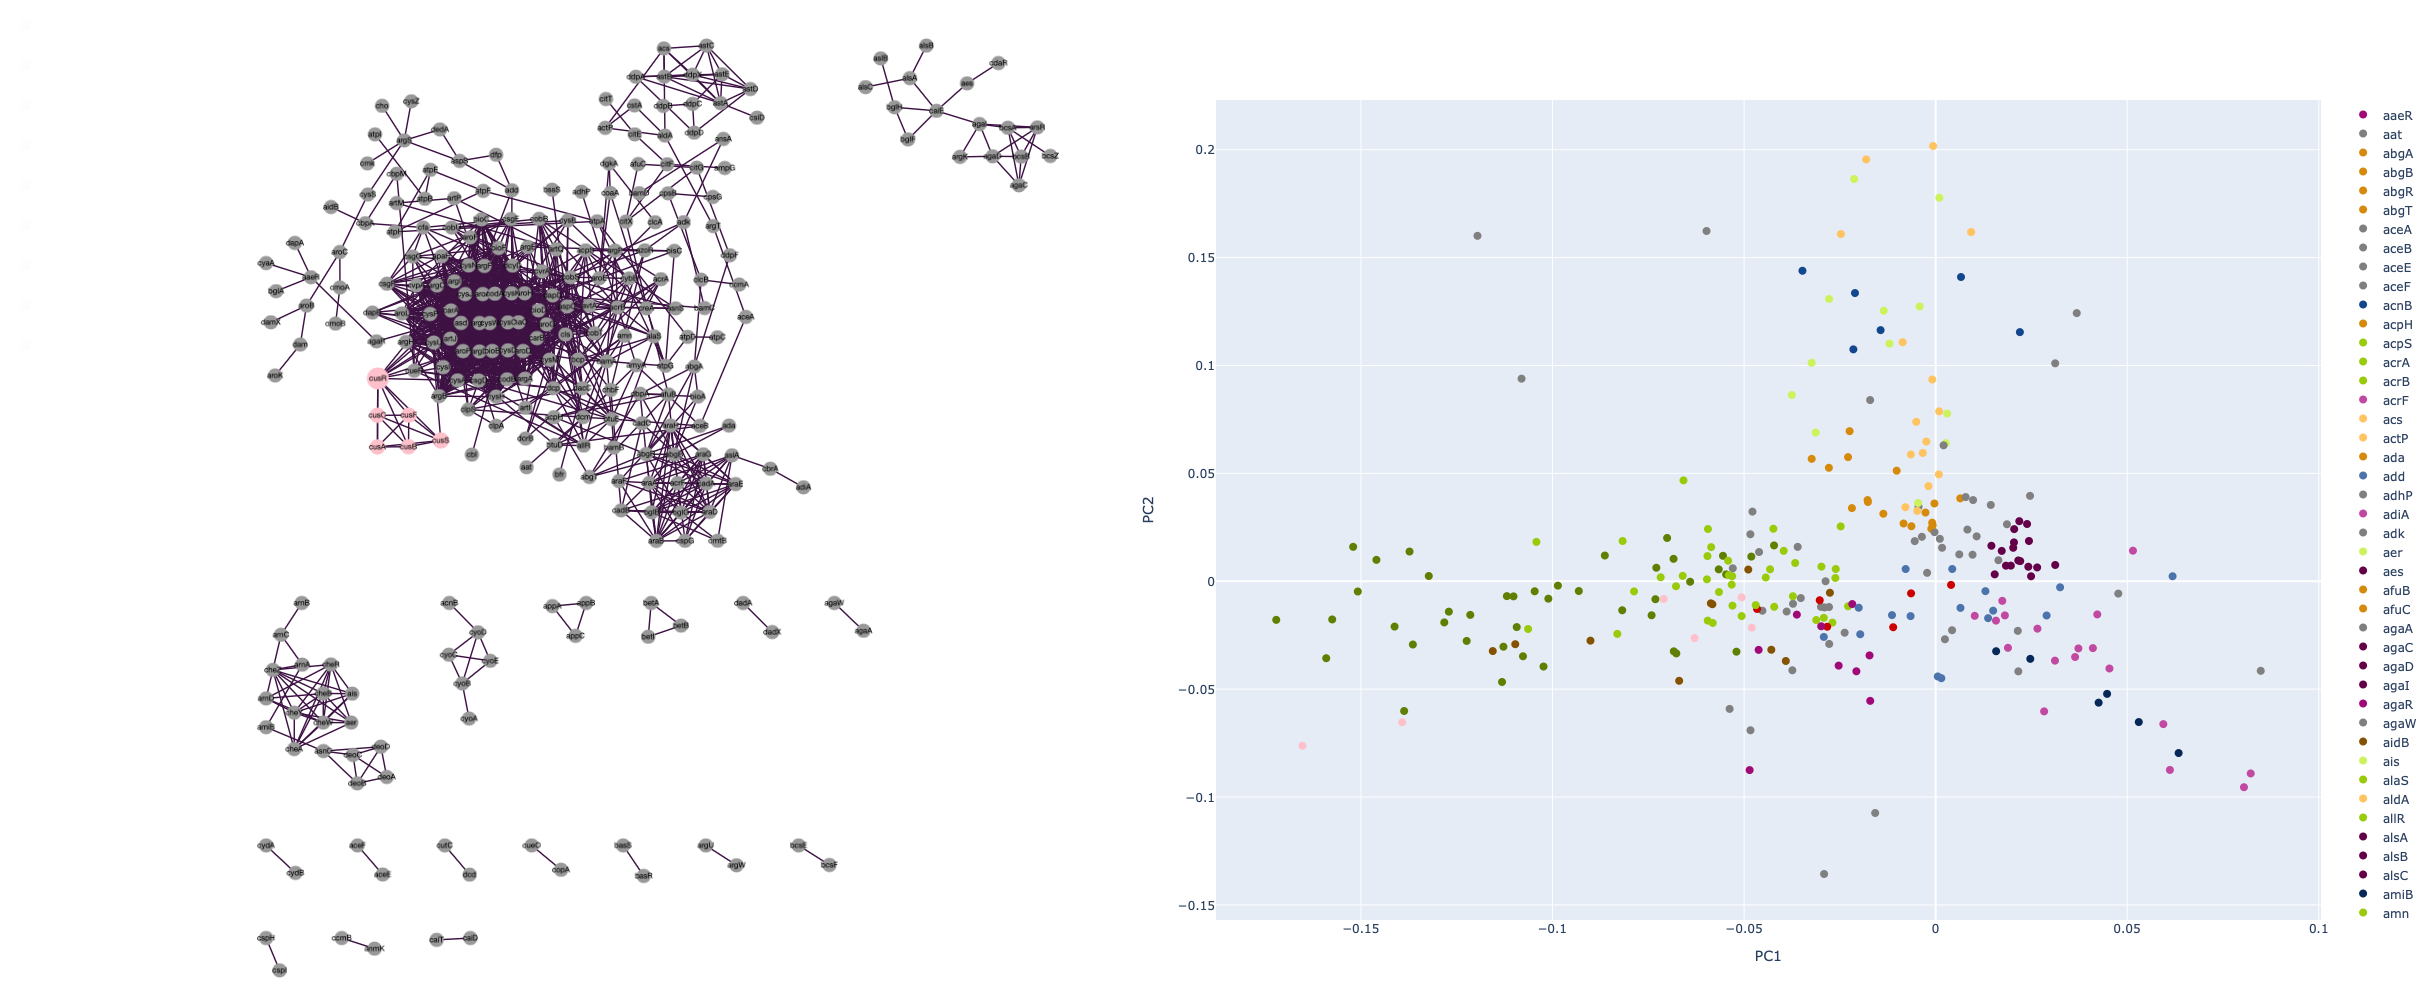
Using the calculated data, we color each gene based on its coloring in the Louvain-Graph to showcase the differences between the community detection and the PCA.
// Creation of a pointchart based on the PCA data
let pcaChart =
    let labelArray = rawFrame.RowKeys |> Array.ofSeq

    pcaData
    |> Array.mapi(fun i x ->
        (labelArray.[i]),Chart.Point(
            [x],
            Text=labelArray.[i],
            MarkerColor=(
                if (Map.containsKey (labelArray.[i]) geneNameToColor) then
                    Color.fromHex(Map.find(labelArray.[i]) geneNameToColor)
                else
                    Color.fromString "gray"
                    ))|> Chart.withTraceInfo(Name=labelArray.[i]))
    |> Array.choose(fun (l,chart) -> if List.contains l (vertexList|>List.map snd) then Some chart else None)
    |> Chart.combine
    |> Chart.withYAxisStyle(TitleText="PC2")
    |> Chart.withXAxisStyle(TitleText="PC1")

pcaChart
While some communities from the Louvain analysis can be spotted in the PCA chart on behalf of their clustering, most of them are widespread, a sign for a high variance in the original dataset. Using a clustering algorithm would lead to a much different communities than the PCA revealed. A mathematical demonstration of this was deemed unnecessary, since most of the data points lie on top of another and would therefore be clustered together.
Ontology Enrichment
Ontology enrichment is a method to identify overrepresented transcript/protein groups in data sets. The used annotation is based on the AnnotationARC . and the calculation is done via BioFSharp.Stats . Here we try to find overrepresented protein functions in the Louvain communities to see if there is a functional modularity or if the communities are not that relevant, just like the PCA suggested. The result of the ontology enrichment can be seen in the following table. The headers are explained in the BioFsharp doku .
#r "nuget: BioFSharp, 2.0.0-beta7"
#r "nuget: BioFSharp.Stats, 2.0.0-beta6"

open BioFSharp
open BioFSharp.Stats

// Maps the gene name to its molecular function based on the AnnotationARC
let geneNameToMolecularFunction =
    let d :Frame<string,string>=
        Frame.ReadCsv(@"../../files/ecoliGeneExpression.tsv",separators="\t")
        |> Frame.take 500
        |> Frame.indexRows "Key"

    let col :Series<string,string>=
        Frame.getCol "Gene ontology (molecular function)" d

    Seq.map2 (fun name f -> (name,f)) (col|> Series.keys) (col|> Series.values)
    |> Map.ofSeq

// List of all the community identifiers we want to use for ontology enrichment
let moduleNumbers = [|0..34|]

// Create the ontology terms on the gene data
let ontologyTerms =
    Vertices.getLabelList louvainGraph
    |> Array.map(fun (name,community) -> (name,[|1.223;2.123123|],community,(Map.find name geneNameToMolecularFunction)))
    |> Array.map (fun (name,data,modularityClass,annotation) ->
        let annotationProcessed = annotation.Replace ("| ","|")
        OntologyEnrichment.createOntologyItem name annotationProcessed modularityClass data
        |> OntologyEnrichment.splitMultipleAnnotationsBy '|'
        )
    |> Seq.concat

// Run the ontology enrichment on every enty in ontologyTerms
let gseaResult =
    moduleNumbers
    |> Array.map (fun x ->
        x,OntologyEnrichment.CalcOverEnrichment x (Some 5) (Some 2) ontologyTerms
        )

// Return the enriched ontology entries
let ontologyResult =
    gseaResult
    |> Array.map (fun (moduleNumber,moduleEnrichment) ->
        let pvalues = moduleEnrichment |> Seq.map (fun x -> x.PValue)
        let pvaluesAdj = MultipleTesting.benjaminiHochbergFDR pvalues |> Array.ofSeq
        moduleEnrichment
        |> Seq.mapi (fun i x -> x,pvaluesAdj.[i])
        |> Seq.filter (fun (item,pvalAdj) -> item.PValue < 0.05)
        |> Seq.sortByDescending (fun (item,pvalAdj) -> item.NumberOfDEsInBin)
        |> Seq.map (fun (x,pvalAdj) ->
            //TotalUnivers was renamed to TotalUniverse
            [sprintf "%i" moduleNumber; x.OntologyTerm; sprintf "%i" x.TotalUnivers; sprintf "%i" x.TotalNumberOfDE; sprintf "%i" x.NumberInBin;sprintf "%i" x.NumberOfDEsInBin; sprintf "%f"x.PValue ;sprintf "%f" pvalAdj]

            )
        )
    |> Seq.choose(fun x -> if Seq.isEmpty x then None else Some x)
    |> Seq.map (fun x -> List.ofSeq x)
    |> List.ofSeq
    |> List.concat

// Build a Plotly.Net table of the ontology enrichment
let ontologyTable =
    let header = ["<b>Community</b>";"OntologyTerm";"TotalUniverse";"TotalNumberOfDE";"NumberInBin";"NumberOfDEsInBin";"PValue";"pvalAdj"]
    let rows =
        ontologyResult
    Chart.Table(header, rows)

ontologyTable
|> Chart.withSize(1300,1000)
- BioFSharp, 2.0.0-beta7
- BioFSharp.Stats, 2.0.0-beta6
From the table above I have chosen to show community 30 as an example of the differences between community detection and PCA.
let cytoVerticesOntology =
    Array.map2 (fun v l -> (v,l)) (louvainGraph.GetVertices()) (Vertices.getLabelList louvainGraph)
    |> List.ofArray
    |> List.map(fun (v,(l,c)) ->
        let styling = [CyParam.label l;if c=30 then CyParam.color (colorMap.Item (c));CyParam.weight (sqrt (float (louvainGraph.Degree v)) + 1. |> (*) 10.)]
        (Elements.node (string v) styling)

    )
let cytoGraphOntology =

    CyGraph.initEmpty ()
    |> CyGraph.withElements cytoVerticesOntology
    |> CyGraph.withElements cytoEdges
    |> CyGraph.withStyle "node"
        [
            CyParam.shape "circle"
            CyParam.content =. CyParam.label
            CyParam.width =. CyParam.weight
            CyParam.height =. CyParam.weight
            CyParam.Text.Align.center
            CyParam.Border.color =. CyParam.color
            CyParam.Background.color =. CyParam.color
        ]
    |> CyGraph.withStyle "edge"
        [
            CyParam.Line.color "#3D1244"
        ]
    |> CyGraph.withLayout (Layout.initCose (Layout.LayoutOptions.Cose(NodeOverlap = 400,ComponentSpacing = 100)))

While comparing community 30 with its PCA counterpart it becomes apparent that this functional group would not have been detected based on clustering of the PCA. This does not mean that the PCA is without its merits, but merely show that the application of different approached to datasets can and will deliver different results. The combination and comparison between different methods is an important step in data evaluation and should always be considered when thinking about your dataflow.
Further reading
- Blondel, Vincent D; Guillaume, Jean-Loup; Lambiotte, Renaud; Lefebvre, Etienne (9 October 2008). "Fast unfolding of communities in large networks". Journal of Statistical Mechanics: Theory and Experiment. 2008 (10): P10008. arXiv:0803.0476. Bibcode:2008JSMTE..10..008B. doi:10.1088/1742-5468/2008/10/P10008. S2CID 334423
- Fslab
- FSharp.FGL