NB03b Signal detection and quantification
![]()
- Signal detection and quantification
Signal detection and quantification
Signals detected during a LC-MS measurement are pairs of m/z value and ion intensity in time. All signals recorded at a particular retention time in a given mass range compose a spectrum. Thus, in its most raw form, a generic spectrum contains the following information: (i) scan (spectra) number; (ii) retention time; (iii) vector of m/z values; (iv) vector of ion intensities; (v) scan mode. The scan number is a simple enumeration over the measurements. The retention time is the time when the measured peptides were eluting from the column. The m/z values represent the mass over charge values of the ions and ion intensity values are the corresponding ion abundances. The scan mode denotes the operational mode used to record the spectrum. It is either a full scan or the number of the fragmentation scan.
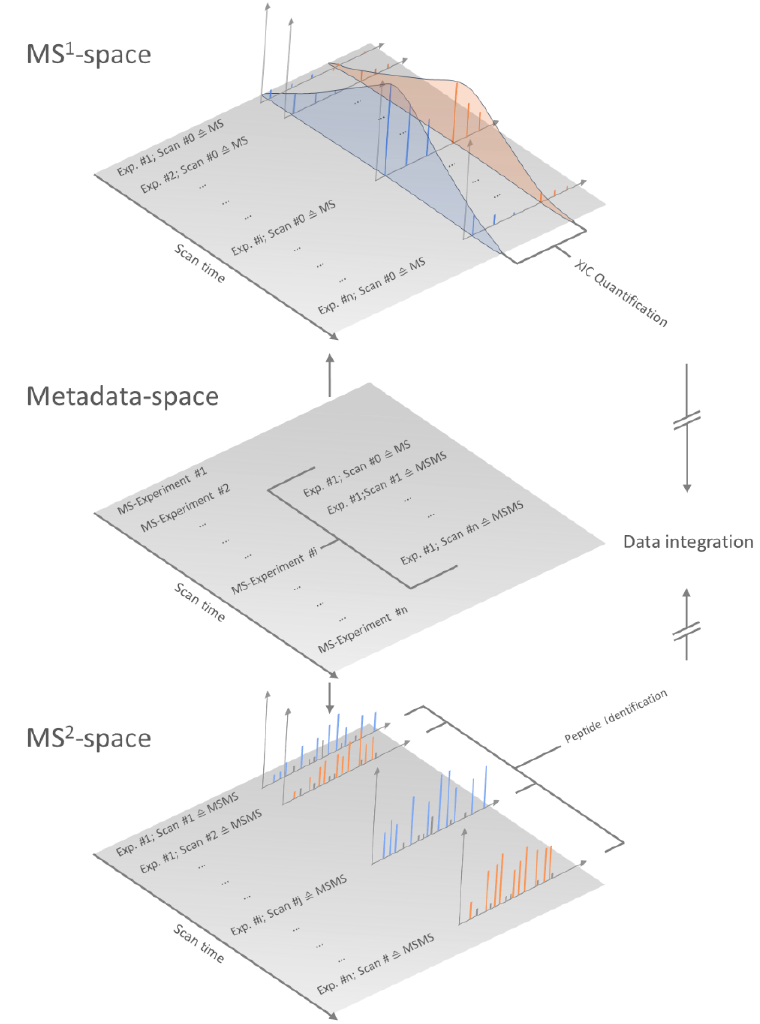
Figure 4: A conceptual view of different spaces of MS derived data sets. (i) The metadata-space serves as a descriptive layer to order, assign and integrate spectra information. (ii) The MS1-space and the (iii) MS2-space represent two independent entities that differ in signal shape, resolution and their information content (‘features’).
Questions
- How can it be benefitial to store meta data and peak data separated from each other?
- A raw ms1 spectrum measured in profile mode can contain up to 150.000 data points. Each data point is given by a value pair: mz and intensity. Lets say you want to encode both values at a very high precision using 64 bit float numbers, how much memory do you need to store one spectrum? How much for a file consisting of 60.000 spectra.
- Can you store the data more efficiently?