NB05a Quantification
![]()
-
Quantification Theory
- Targeted quantification
- (i) Targeted acquisition at peptide
- (ii) Targeted data analysis at peptide ion level
- References
Quantification Theory
To estimate the amount of individual proteins in complex mixtures, all peptide signals corresponding to a common protein serve as a proxy for their abundance. Peptide information needs to be obtained from multidimensional signal data detected by the mass spectrometer. All signals generated from one peptide ion species, often referred to as peptide feature, need to be grouped to form a three-dimensional peak along the m/z, ion intensity, and retention time dimension. This process is generally defined as peak detection or feature detection. Peak detection algorithms are a set of rules defining how neighboring signal points are joined. Whether noise filtering is done before or after peak detection strongly depends on the peak detection algorithm. Traditional approaches mainly focused on signal amplitude neglecting characteristic peak shapes as a common feature of chromatographic or spectroscopic peaks. These algorithms are prone to miss detection of low intensity peaks with a signal strength close to the noise level. To overcome these issues, techniques like smoothing, shape-matching and curve fitting are often implemented and applied. At the time, the most promising approach to do shape-matching and noise reduction in one step uses the continuous wavelet transformation (CWT).
In general, a CWT based approach describes a family of time-frequency-transformations often used in data compression and feature detection. The term is coined by the use of a wavelet, as a basis function which is “compared” to the signal. The point of highest correlation between the basis function and the signal reflects the location of the peak present. Due to the fact that MS derived peaks often follow the shape of a gaussian distribution, the Mexican Hat wavelet as the negative normalized second derivative of the Gaussian distribution is perfectly suited to find the peptide feature.
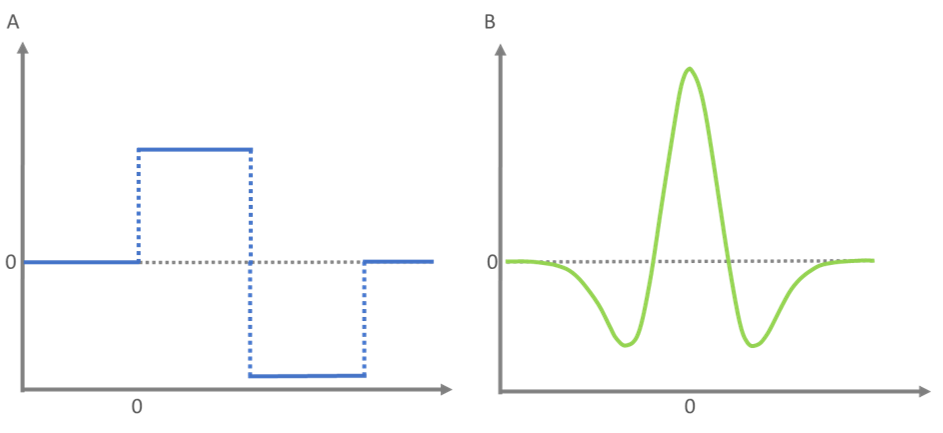
Figure 6: Schematic representation of the ‘Haar’-wavelet (blue) and the ‘Mexican Hat’- wavelet (green). The ‘Haar’-wavelet is named after its discoverer Alfred Haar and represents the first wavelet ever to be described. The ‘Mexican Hat’- or ‘Ricker’-wavelet is frequently used in the fields of signal detection and compression.
Depending on the quantification approach, the peptide features used for protein quantification might differ. In case of isotopic labeling, quantification means pairing features with the proper mass shift according to the utilized label. It is essential to account for the frequency of label incorporation when calculating the mass shift for the utilized label. Taking the ICAT method as an example, by which a heavy/light difference of 9 Dalton per cysteine is incorporated, the total mass shift is 9 Dalton times the number of cysteine within the sequence. Consequently, pairing peptide features for 15N labeling is even more challenging, as the mass shift is less discrete. Using stable isotope labeling, different peptide feature pairs belonging to the same protein can be treated as technical replicates and averaged to gain protein quantification. In contrast, the sum of all extracted peptide signals results in a label-free protein quantification. Spectral counting computes abundance values from the number of times a peptide was successfully identified by tandem mass spectrometry (MS/MS) and combines all these events per protein. The spectral counting values can be normalized by the number of peptides theoretically expected from the particular protein.
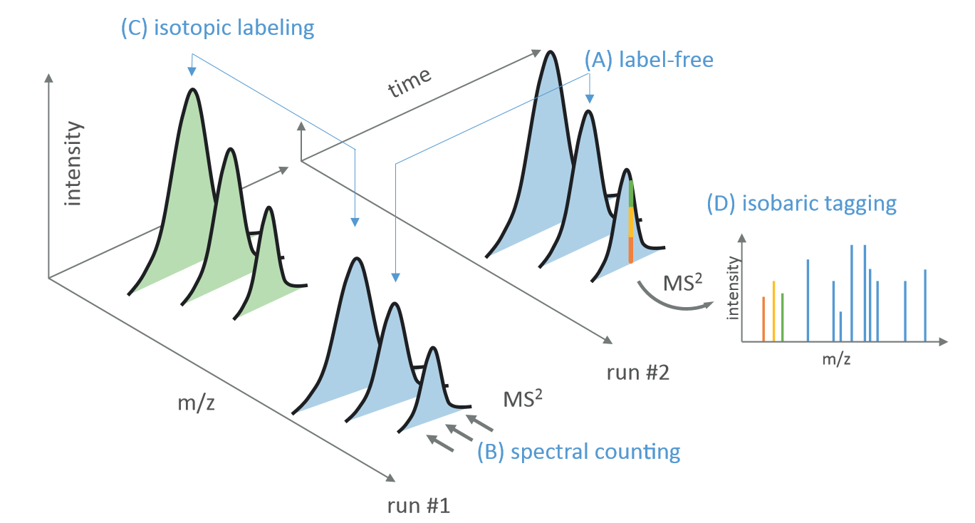
Figure 7: Computational strategy of peptide and protein quantification on based on stable isotope labeling or by label-free quantification. (A) Label-free methods compare corresponding peptide abundances over different MS runs. The abundance is either estimated by the elution profile les of the pep de ions or (B) in case of spectral counting, by the number of times a peptide was successfully identified (MS2). In contrast, methods based on differential stable isotope labeling analyze peptides pairs detected by their characteristic mass difference Δm/z. The abundance is estimated by the ratio of their corresponding elution profiles (C). Isobaric tagging methods (D) compare the reporter ion abundances in the fragmentation spectrum.
Targeted quantification
Targeted proteomics has gained significant popularity in mass spectrometry‐based protein quantification as a method to detect proteins of interest with high sensitivity, quantitative accuracy and reproducibility. The two major strategies of (i) targeted acquisition at peptide, and (ii) targeted data analysis at peptide ion level need to be distinguished.
(i) Targeted acquisition at peptide
In multiple reaction monitoring (MRM or SRM for single/selected reaction monitoring) simply predefined transitions are recorded. Knowledge about the targeted transitions from precursor to their corresponding fragment ions are needed and predefined in the mass spectrometer. MRM can be performed rapidly and is highly specific even for low abundant peptide ions in complex mixtures, but with the drawback of a necessary bias in the sense that only predefined peptides are measured.
(ii) Targeted data analysis at peptide ion level
Data‐independent acquisition at the peptide level makes it possible to acquire peptide data for virtually all peptide ions present in a sample. In this strategy, a high‐resolution mass analyzer—such as an orbitrap or a time‐of‐flight—is used to constantly sample the full mass range at the peptide level during the entire chromatographic gradient. In a subsequent step, precursor ion chromatograms can be extracted by targeted data analysis. Those extracted-ion chromatogram (XIC) can be obtained to calculate the area under the curve and used for peptide quantification.
Let’s start and extract a XIC…
#r "nuget: FSharp.Stats, 0.4.3"
#r "nuget: BioFSharp, 2.0.0-beta5"
#r "nuget: BioFSharp.IO, 2.0.0-beta5"
#r "nuget: Plotly.NET, 4.2.0"
#r "nuget: System.Data.SQLite, 1.0.113.7"
#r "nuget: BioFSharp.Mz, 0.1.5-beta"
#r "nuget: MzIO, 0.1.1"
#r "nuget: MzIO.SQL, 0.1.4"
#r "nuget: MzIO.Processing, 0.1.2"
#r "nuget: BIO-BTE-06-L-7_Aux, 0.0.10"

#if IPYNB
#r "nuget: Plotly.NET.Interactive, 4.2.0"
#endif // IPYNB

open Plotly.NET
open FSharp.Stats
open BioFSharp
open System.IO
open System.Data.SQLite
open BIO_BTE_06_L_7_Aux.FS3_Aux
We now want to extract the XIC for the peptide where we previously calculated the matching score.
Since we need several mass spectrometry scans to quantify over the retention time, we connect to our database and index the entries according to their retention time.
// Code-Block 1
let directory = __SOURCE_DIRECTORY__
let path = Path.Combine[|directory;"downloads/sample.mzlite"|]
downloadFile path "sample.mzlite" "bio-bte-06-l-7"
let runID = "sample=0"

let mzReader = new MzIO.MzSQL.MzSQL(path)
let cn = mzReader.Open()
let transaction = mzReader.BeginTransaction()

// Indexes all spectra of the related sample run
let idx = MzIO.Processing.Query.getMS1RTIdx mzReader runID
idx
|
We know from the MS2 measurement, that our peptide had its match at a retention of around 51.95 min. We create a query to the database to extract the intensities of all peaks that are +/-5 min of our retention time and within 0.04 m/z of our peptide of interest. After we are done, we close the connection to the database.
// Code-Block 2

let retentionTime = 51.95
let mzAtCharge2   = 511.2691141

let rtQuery = MzIO.Processing.Query.createRangeQuery retentionTime 5.

let mzQuery = MzIO.Processing.Query.createRangeQuery mzAtCharge2 0.04

let xic =
    MzIO.Processing.Query.getXIC mzReader idx rtQuery mzQuery
    |> Array.map (fun p -> p.Rt , p.Intensity)

transaction.Dispose()

let xicChart =
    xic
    |> Chart.Point
    |> Chart.withXAxisStyle "Retention Time"
    |> Chart.withYAxisStyle "Intensity/Score"
    |> Chart.withSize (900.,900.)

xicChart
|
We have now the XIC in our hands and can use the second derivative to identify peaks with our trace.
// Code-Block 3

// get all peaks
let peaks =
    xic
    |> Array.unzip
    |> (fun (ret, intensity) ->
        FSharp.Stats.Signal.PeakDetection.SecondDerivative.getPeaks 0.1 2 13 ret intensity
        )

peaks |> Array.head
|
The peak model includes numerus information. Therefore we can mark the apices of the peaks we identified.
// Code-Block 4

let apices =
    peaks
    |> Array.map (fun peak -> peak.Apex.XVal,peak.Apex.YVal)

let apicesChart=
    [
        Chart.Point(apices, Name = "apices")
        |> Chart.withMarkerStyle(Size = 15)
        Chart.Point(xic, Name = "XIC")

    ]
    |> Chart.combine
    |> Chart.withXAxisStyle "Retention Time"
    |> Chart.withYAxisStyle "Intensity"
    |> Chart.withSize (900., 900.)

apicesChart
|
We can then go ahead and characterize our peak and quantify the area under the fitted curve.
// Code-Block 5

// get peak at "ret=51.95" from all peaks "peaks"
let quantifiedXIC =
    BioFSharp.Mz.Quantification.HULQ.getPeakBy peaks retentionTime
    // quantify peak of interest
    |> BioFSharp.Mz.Quantification.HULQ.quantifyPeak

quantifiedXIC.Area
|
The peak model gives us all the information we need for our peptide of interest. If we want to see what we quantified, we can take an exponential modified gaussian function using the parameters given by the peak model and plot it together with the previously extracted XIC.
// Code-Block 6

let eval x =
    Fitting.NonLinearRegression.Table.emgModel.GetFunctionValue (vector quantifiedXIC.EstimatedParams) x

eval
// Code-Block 7

let quantifiedArea =
    xic
    |> Array.map (fun (rt,i) -> rt, eval rt)

let quantifiedAreaChart =
    [
        Chart.Point(xic, Name="XIC")
        Chart.SplineArea(quantifiedArea, Name = "quantified XIC")
    ]
    |> Chart.combine
    |> Chart.withXAxisStyle (TitleText = "Retention Time", MinMax = (51.,58.))
    |> Chart.withYAxisStyle "Intensity"
    |> Chart.withSize (900., 900.)

quantifiedAreaChart
|
Questions
- How does the Chart created by Code-Block 2 change, when you change the value of 'retentionTime' to 53.95? What does this parameter specify?
- How does the Chart created by Code-Block 2 change, when you change the value of the parameter 'offset' from 5 to 10 or 20?
- How does the Chart created by Code-Block 4 change, when you change the value of the parameter snr from 0.1 to 2.1? What does this parameter specify, what does the abbreviation snr stand for?
- How does the Chart created by Code-Block 7 change, when you change the value of the parameter retentionTime in CodeBlock 5 to 55.15?
- Have a look at the peaks, how are the peaks shaped, are the shapes symmetric?
- What does the term "peak tailing" imply.
- What factors determine peak shape? Think of explanations (e.g. biochemical-interactions, detection method) for different peak shapes.
- How many parameters does the model have (see quantifiedXIC.EstimatedParams, Code-Block 6), what does the abbreviation "EMG" stand for and how is this function different from a gaussian function?
- How could the fit created by the change in Code-Block 5, 6 and 8 profit from baseline correction?
<summary>Performs operations on <see cref="T:System.String" /> instances that contain file or directory path information. These operations are performed in a cross-platform manner.</summary>
Path.Combine(path1: string, path2: string) : string
Path.Combine(path1: string, path2: string, path3: string) : string
Path.Combine(path1: string, path2: string, path3: string, path4: string) : string
<summary>Contains operations for working with arrays.</summary>
<remarks> See also <a href="https://docs.microsoft.com/dotnet/fsharp/language-reference/arrays">F# Language Guide - Arrays</a>. </remarks>
<summary>Builds a new array whose elements are the results of applying the given function to each of the elements of the array.</summary>
<param name="mapping">The function to transform elements of the array.</param>
<param name="array">The input array.</param>
<returns>The array of transformed elements.</returns>
<exception cref="T:System.ArgumentNullException">Thrown when the input array is null.</exception>
<summary>Splits an array of pairs into two arrays.</summary>
<param name="array">The input array.</param>
<returns>The two arrays.</returns>
<exception cref="T:System.ArgumentNullException">Thrown when the input array is null.</exception>
<summary>Returns the first element of the array.</summary>
<param name="array">The input array.</param>
<returns>The first element of the array.</returns>
<exception cref="T:System.ArgumentNullException">Thrown when the input array is null.</exception>
<exception cref="T:System.ArgumentException">Thrown when the input array is empty.</exception>