


PSMStatistics
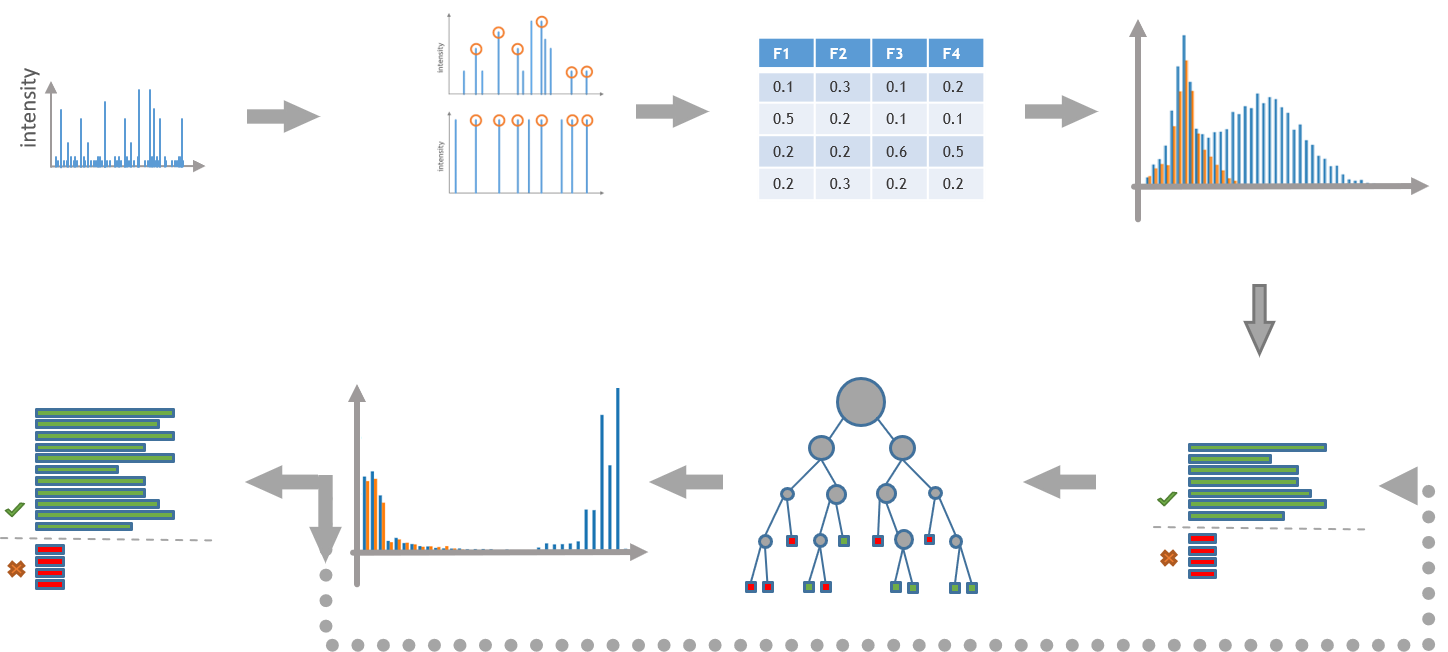
PeptideSpectrumMatching reports several scores for every spectrum (SEQUEST-like, Andromeda-like, X!Tandem-like, plus mass error, peptide length and how far the best candidate is ahead of the next one). PSMStatistics learns one combined score from these columns. It uses the target and decoy labels of the matches as training signal, retrains in iterations while the set of confident targets grows (semi supervised), and stops when an iteration adds too few new positives or the iteration limit is reached. From the combined score it computes a q-value and a PEP value per match and keeps the PSMs under both thresholds.
Inputs and outputs
Flag |
Meaning |
Comes from |
|---|---|---|
|
one or more |
|
|
the SQLite peptide database |
|
|
the output directory, created when missing |
|
|
the parameter file in JSON |
this page |
|
switch: save diagnostic charts to the output directory |
|
|
number of files scored at the same time, default 1 |
For every input run.psm the tool writes run.qpsm to the output directory. The file is tab separated with a header and holds one row per scan: the identifiers of the peptide and its modification state, the search scores, the combined ModelScore, QValue, PEPValue, the sequence and the protein names.
ProteinInference and PSMBasedQuantification read .qpsm files.
The tool also creates a run_plots directory per input. It stays empty unless you pass -dc, which adds Metrics.html and InitialSeparation.html, plus one separationAtIteration_<n>.html per training iteration. Charts exist only for the estimated threshold. Log output goes to PSMStatistics_log.txt and run_log.txt in the output directory.
Parameters
Parameter |
Default |
Meaning |
|---|---|---|
|
|
Learn the combined score and filter by q-value and PEP value. The nested record is listed below. |
|
|
Skip the learning. Keep the best match per scan among those whose |
|
|
Regex applied to the FASTA headers of the database to produce the |
|
|
Part of the parameter record. Keep it at |
The fields of Threshold.Estimate:
Parameter |
Default |
Meaning |
|---|---|---|
|
|
Keep PSMs with a q-value below this value. |
|
|
Keep PSMs with a PEP value below this value. |
|
|
Upper limit for the retraining iterations. |
|
|
Stop when the number of positives at the q-value threshold grows by less than this fraction from one iteration to the next. |
|
|
How the PEP curve is fitted. |
The default file is pSMStatisticsParams.json.
Writing a parameter file
open ProteomIQon
open ProteomIQon.Domain

let psmStatisticsParams : Dto.PSMStatisticsParams =
    {
        Threshold =
            Threshold.Estimate
                {
                    QValueThreshold                  = 0.01
                    PepValueThreshold                = 0.05
                    MaxIterations                    = 15
                    MinimumIncreaseBetweenIterations = 0.005
                    PepValueFittingMethod            = PepValueFittingMethod.IRLS
                }
        ParseProteinIDRegexPattern = "id"
        KeepTemporaryFiles         = true
    }

// Replace the temp folder with your project folder.
let outputPath = System.IO.Path.Combine(System.IO.Path.GetTempPath(), "pSMStatisticsParams.json")

Json.serializeAndWrite outputPath psmStatisticsParams
Running the tool
Install with dotnet tool install --global ProteomIQon.PSMStatistics, then score one run:
|
Several runs at once, three of them in parallel:
|
Add -dc to write the separation charts for each iteration:
|
All flags:
|
module PSMStatisticsParams from ProteomIQon.Dto
--------------------
type PSMStatisticsParams = { Threshold: Threshold ParseProteinIDRegexPattern: string KeepTemporaryFiles: bool } member Equals: PSMStatisticsParams * IEqualityComparer -> bool
<summary>Performs operations on <see cref="T:System.String" /> instances that contain file or directory path information. These operations are performed in a cross-platform manner.</summary>
System.IO.Path.Combine([<System.ParamArray>] paths: string array) : string
System.IO.Path.Combine(path1: string, path2: string) : string
System.IO.Path.Combine(path1: string, path2: string, path3: string) : string
System.IO.Path.Combine(path1: string, path2: string, path3: string, path4: string) : string